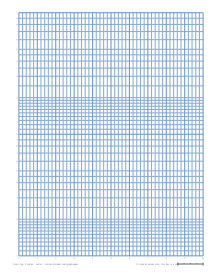
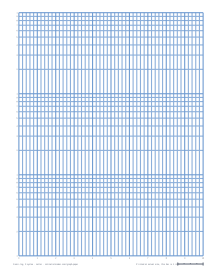
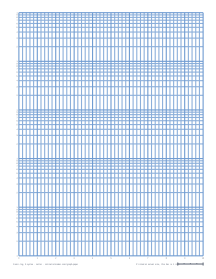
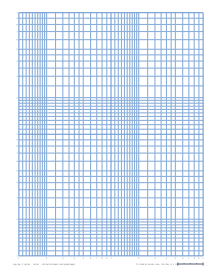
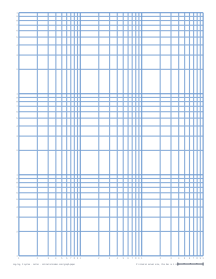
What a cycle is
A cycle (or decade) is one factor of ten: 1 to 10, 10 to 100, and so on. Within each cycle the lines fall at 1, 2, 3 … 9 and get closer together as they climb, because the spacing follows log₁₀ of the value. The labels repeat 1–9 in each cycle; you write in the actual powers of ten for your data (for example 1, 10, 100, 1000 at the bold lines).
Which paper for which data
- Semi-log (one log axis): anything that grows or decays by a constant percentage, such as bacteria, compound interest, radioactive decay or a cooling curve, plots as a straight line. The slope gives the rate.
- Log-log (both log axes): power laws (y = a·xⁿ) plot as straight lines with slope n. Common in physics labs, frequency response plots and scaling laws.
Pick enough cycles to cover your data: values from 3 to 4,000 span 1 to 10,000 = four cycles.